Traffic Survey 2017
Bomere Heath Parish Council Traffic Survey Summary
On the 23rd June 2017, Tracsis plc working with Mouchel, carried out a traffic survey’s at 5 locations within the Parish of Bomere Heath and District. These 5 locations have been identified by the Parish Council, who had identified these through their own experiences and comments presented by parishioners as “trouble spots”. It was deemed by the PC that these 5 areas required some detailed analysis.
Unfortunately, due to departmental cut backs within the highways dept. they are now limited to 6 surveys per year for the entire of Shropshire. There was no certainty as to when the 5 Bomere Heath sites could be surveyed and suggested that we may only get 2 sites surveyed per annum.
To that end, BHPC agreed that due to the importance of the concerns raised at PC meetings, we would fund the surveys ourselves at a cost of £2,345 ensuring that the critical areas identified were inspected. The survey was carried out under industry guidelines, between Friday the 23rd June 2017 to Thursday 29th June Inclusive.
The 5 locations are
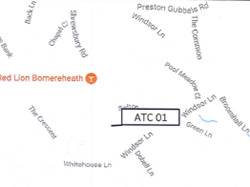
Site 1 - Bomere Heath (Windsor Lane) – Page 2
Site 2 - Bomere Heath Merrington Road – Page 3
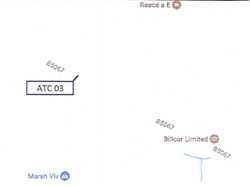
Site 3 – Walford Heath – Page 4
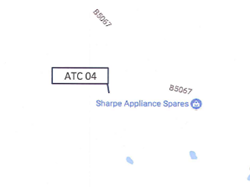
Site 4 – Leaton Crossroads – Page 5
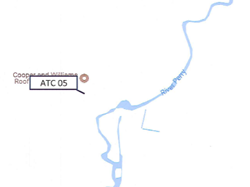
Site 5 – Forton Heath – Page 6
This report gives a breakdown of the findings.
Site 1 – Bomere Heath – Shrewsbury Road (Between Windsor Lane and Sefton Drive)
Speed Limit at location– 30mph
During the survey period, there were a total of 15,209 cars passed over this location. 8,204 were heading to Merrington, 7,005 towards Harlescott.
The average speed was 24.1 mph
The average speed at the 85th % (This is the speed that 85% of vehicles DO NOT exceed) is 28.6mph
227 vehicles travelled faster than 35mph and 2 faster than 45mph
The fastest speed was recorded on Wednesday at between 50 – 55mph
Per annum extrapolation = 790,868 vehicle movements
Site 2 – Bomere Heath – Merrington Road (just beyond Brook Road)
Speed Limit at location – 30mph
During the survey period, there were a total of 7,734 cars passed over this location. 4,040 were heading to Merrington, 3,694 towards Bomere Heath.
The average speed was 26.9 mph
The average speed at the 85th % is 32.7 mph
662 vehicles travelled faster than 35mph and 24 faster than 45mph showing that this side of the village receives a higher % of cars that travel at faster speeds.
The fastest speed was recorded on Sunday evening at between 60 – 65mph
Per annum extrapolation = 402,168 vehicle movement
Site 3 – Walford Heath – on the B5067 beyond the Old Woods Cross roads
Speed Limit at location - 40mph
During the survey period, there were a total of 32,377 cars passed over this location. 16,110 were heading to Shrewsbury, 16,267 towards Baschurch.
The weekday average numbers of cars were recorded at circa 5,000 per day
The average speed was 38.9mph
The average speed at the 85th % is 44.8 mph
3,934 (12.2%) of vehicles travelled faster than 46mph and 511 (1.6%) faster than 55mph
The fastest speed was recorded on Sunday travelling between 85 – 135mph
Per annum extrapolation = 1,683,604 vehicle movements
Site 4 – Leaton Cross Roads– just off the B5067 towards Fitz
Speed Limit at location – 60mph
During the survey period, there were a total of 18,288 cars passed over this location. 8,186 were heading to Shrewsbury, 10,102 towards Fitz.
The weekday average numbers of cars were recorded at circa 3,000 per day
The average speed was 36.4mph
The average speed at the 85th % is 42.0 mph
2 (0.0%) of vehicles travelled faster than 68mph and 0 faster than 75mph
The fastest speed was recorded on Saturday travelling between 70 – 75mph
This road has been deemed (by local parishioners) as an area of concern based on the layout of the road and the proximity of the junction to the recorded location, the national average speed of 60MPH is a high benchmark, to acknowledge this concern we have the following additional data.
Speed |
Number |
Column % of Total (18,288) |
|---|---|---|
40-45 |
906 |
4.95% |
45-50 |
230 |
0.12% |
50-55 |
53 |
0.02% |
55-60 |
15 |
0.01% |
60-65 |
5 |
0 |
65-70 |
1 |
0 |
Per annum extrapolation = 950,976 vehicle movements
Site 5 – Forton Heath – By Cooper and Williams Yard
Speed limit at location – 60mph
During the survey period, there were a total of 23,242 cars passed over this location. 10,383 heading towards Fitz, 12,859 towards Montford Bridge.
The weekday average numbers of cars were recorded at circa 3,700 per day
The average speed was 39.8mph
The average speed at the 85th % is 48.7 mph
A total of 338 people were recorded as speeding (Faster than 60MPH)
74 (0.3%) of vehicles travelled faster than 68mph and 23 (0.1%) faster than 75mph
The fastest speeds were recorded on Tuesday and Wednesday, both travelling between 85 – 135mph
Per annum extrapolation = 1,208,584 vehicle movements.
Summary
In summary, the average speeds are within the guidance for maintaining the current speed limits. External bodies would review the speed at the 85th percentile when reviewing this data and Bomere Heath (at the time of the data capture) is generally within the 10% +1 threshold that enforcement would take action.
Bomere Heath location 1 is well within the limit. Walford Heath is just within the threshold and Leaton and Forton Heath are well within because these are judged on the 60mph national speed limit. Bomere Heath location 2 is above the PSL but generally within the enforcement threshold.
What is apparent is that across the 5 locations is there was a great deal of speeding above the PSL (Posted Speed Limit)
Location |
PSL |
TOTAL No of Vehicles |
No ABOVE the PSL |
% |
|---|---|---|---|---|
1 Bomere Heath (sch) |
30 |
15,209 |
1,458 |
9.8% |
2 Bomere Heath |
30 |
7,734 |
2,459 |
31.8% |
3 Walford Heath |
40 |
32,377 |
12,512 |
38.6% |
4 Leaton |
60 |
32,377 |
21 |
0.1% |
5 Forton Heath |
60 |
23,242 |
338 |
1.5% |
In our villages and communities several individuals, both from and travelling through our parish have an increased speed above the posted speed limit, posing a risk to our families and other road users. I f we can encourage drivers within our own families to take note of the speed limits, particularly in the built up areas, we could all help to reduce these numbers and the numbers of accidents and near misses in or area.
The statistics also highlight there is a marked change of a speed increase at the Merrington end of Bomere Heath compared to outside the School at Location 1.
Site 4 and 5 are particularly low based on the PSL, however, both locations are near to junctions and have been identified as areas of concern based on comments and complaints over recent years and the PC should seek advice to put additional measures in.
The statistics also identify one frightening fact that 69 vehicles were travelling at Motorway speeds within our parish, most committed in the quieter Forton Heath area. Thankfully, none of these speeds were recorded in our most built up area, however, in one 7 day period in June, 69 drivers thought it acceptable to travel at the same speed as the legal maximum as the M1. If this is a normal average, over a 1 year period, 3,588 vehicles would travel at speeds in excess of 70mph in our Parish!
This needs to be considered and potentially a campaign of awareness embarked upon.
